A community can earn the label “vulnerable” in a number of ways. For example, the whole of New Orleans is dependent on a levee system that keeps the Mississippi River and Lake Pontchartrain at bay. During Katrina, we all saw the damage when that levee system failed.
While we each experience a level of vulnerability here from hurricanes, boil water advisories, and potholes, there are neighborhoods within New Orleans that experience more acute vulnerabilities like being low-income, residing in food deserts, and living with higher health risks. When looking into Entergy New Orleans’ Resiliency Plan, my organization, Resilience New Orleans, conducted a study to determine how the upgrades and cost would affect these more vulnerable communities. But first, we had to define “vulnerable”. Turns out, there are some great resources that get at the vulnerability issue from several different angles.
Economic Vulnerability
The Census tracts are defined geographic areas that show percent of people living at or below the poverty level. For 2024 in Louisiana, the federal poverty income guidelines defined as $30,000 annual income for a family of four, $14,580 for an individual.
Social Vulnerability
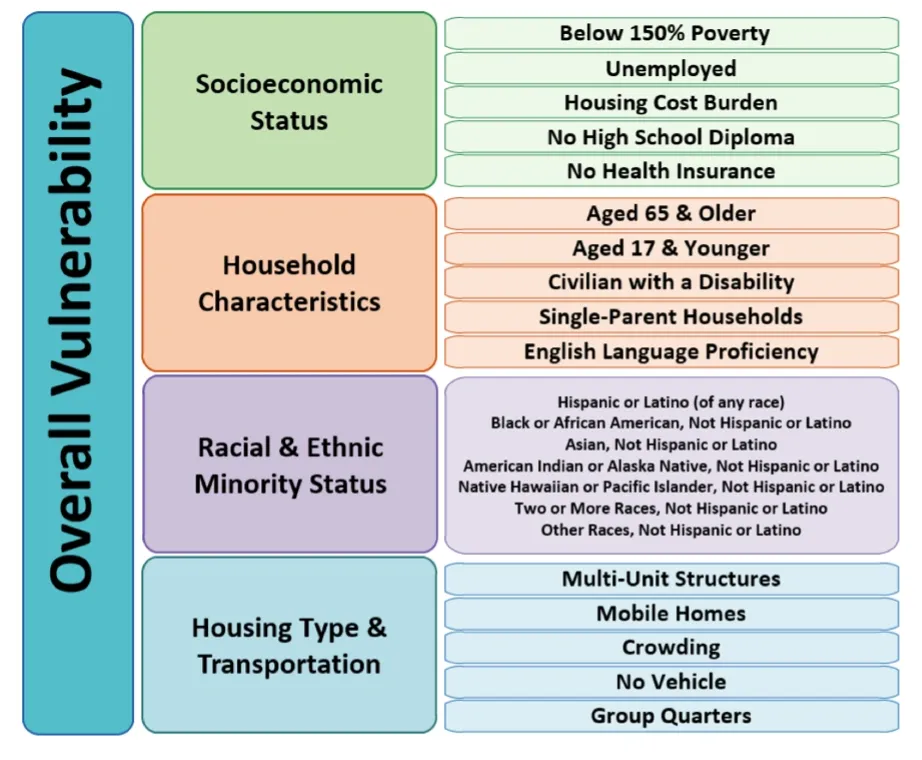
The Centers for Disease Control Social Vulnerability Index (CDC/ATSDR SVI 2020) was designed to identify potential negative effects on communities caused by external stresses that impact human health. Stresses are grouped into four categories as shown below.

Orleans Parish, Louisiana
2020 National Overall SVI Score:
0.8329
Possible scores range from 0 (lowest vulnerability) to 1 (highest vulnerability). A score of 0.8329 indicates a high level of vulnerability.
Environmental Vulnerability
The Council on Environmental Quality (CEQ) were directed by Executive Order to create a Climate and Economic Justice Screening Tool to provide information about environmental burdens experienced by communities across the U.S. The map is full of information and can scale down to the census tract level. From there, the map gives rankings for vulnerability to climate change, energy, health, housing, pollution exposure, transportation, water and wastewater, and workforce development. If you go to the map, you can find the vulnerabilities specific to your neighborhood. I looked up my New Orleans’ neighborhood and found it is in the 99th percentile for:
Climate Change – Expected building loss rate
Economic loss to building value resulting from natural hazards each year.
Health Vulnerability
The Department of Health and Human Services (HHS) emPOWER Map tracks vulnerable patients with electricity dependent medical equipment. Over 3 million Medicare beneficiaries rely on electricity-dependent devices to live independently. Power outages are life-threatening events for these patients. The HHS emPOWER map shows the number of beneficiaries within each zip code.
Nutrition Vulnerability
The USDA Food Access Research Atlas is a map showing food access indicators using different measures of limited access to sources of healthy and affordable food. Accessibility is measured by distance to a store or by the number of stores in an area, family income, and transportation availability. The map allows the user to define the low-income and low-access indicators by distance.
Transportation Vulnerability
The U.S. DOT Equitable Transportation Community (ETC) Explorer is an interactive map showing the cumulative burden to communities as a result of underinvestment in transportation. The risk is defined by a “Disadvantaged component score” based on Climate and Disaster Risk Burden, Environmental Burden, Health Vulnerability, Social Vulnerability, and Transportation Insecurity. For Orleans Parish, 33% of the city (111.8k people) is disadvantaged.
Energy Stressed
“Energy Stressed” is defined as a community with a high percent of electric customers paying 10% or more of their monthly income toward the utility bill.
Using all seven of these vulnerability factors, my organization’s study, “Analyzing How Entergy New Orleans’ Resiliency Plan Will Benefit the City’s Most Vulnerable Populations,” found that decreasing outages is a no-brainer. The ten-year, $1 billion plan will upgrade our electrical grid making it more resilient and reliable. We calculated the direct benefits to vulnerable communities and found the following:
- $453 million in investments to designated vulnerable areas will result in ~$1.25 billion in benefits.
- Vulnerable areas make up 38% of communities but will receive about 44% of the investments.
- Specific populations – those living in a food desert, those with chronic health conditions, and those who work for hourly wages – will see significant benefits from less outages
- Reduction in food losses save up to $141 million per year.
- For every dialysis treatment day, health centers that remain open after an event will save residents from $350 to $900 thousand.
- Urgent care centers near upgraded lines that remain operational after a storm event would save $1.3 to $1.8 million per day.
- ~86,000 employees work in areas scheduled for a resilience upgrade, including 20,500 lower wage positions earning less than $1,250 per month.

